Chapter 4: Charts, Graphs, and Lines
Section 4.1- Graphs and Charts
Have you ever had difficulty finding locations of objects on maps? If you haven’t yet had that experience, then I have a little activity for you. At the end of your Bible (King James Version – LDS Edition) there are several maps. On any of the 13 or so maps, try to find the following locations:
Bethsaida |
Unless you have some help, it might take you a while. Let’s walk through a couple of them together. Right before the maps is an Index of Place-Names. First, we look up Bethsaida. In the edition I have, I find Bethsaida and right next to it is listed 11:C3. The map we have to look at is number 11, but what does the C3 mean? Well, if you turn to map #11 you will notice that across the top are letters and then there are numbers along the side. If you go straight down from C and straight across from 3, you will be right in the vicinity of Bethsaida (right on the north shore of the Sea of Galilee).
Next we will look at the Samothrace. In the Index of Place-Names we find that it is located on map 13:E1. Go to map #13. This has letters up the side and numbers along the top. Go straight across from E and straight down from 1, and you will find a small island with the name of Samothrace.
Here is an example from the maps at the end of the Doctrine and Covenants: Find Harmony, Pennsylvania.
In the Index of Place-Names we see that Harmony, Pennsylvania is on two maps, 1:B3 and 3:H3. So we go to map #3 straight down from H and straight across from 3 and find Village of Harmony.
If you aren’t familiar with the map, the little grid set up by using one letter and one number is absolutely indispensible.
Because letters and numbers go in definite orders, they are called ordinates. When they are used together to pinpoint an exact location, they are then called coordinates. The use of coordinates to find an exact location was introduced into mathematics centuries ago by a man named Rene Descartes. Now his method to specify locations is used widely in the world. Longitude and latitude are the two numbers that, when used together, can give us an exact location on the planet; longitude and latitude also form the basis for all ship and plane navigation.
Using coordinates is also valuable in being able to read charts and “see” trends that aren’t so readily picked up by only seeing the numbers. Here is an example of a savings account and how it has grown: |
 |
Year |
Amount |
2001 |
$8.31 |
2002 |
$17.48 |
2003 |
$28.00 |
2004 |
$56.39 |
2005 |
$72.48 |
2006 |
$85.34 |
The chart helps to visualize the growth.
Notice how the graph is made by plotting each set of coordinates.
The standard coordinate system that is used in math is called the Cartesian Coordinate System. It was created by Descartes (hence the name Cartesian) and uses numbers (positive or negative) for both the horizontal and the vertical measuring. Here is the system and the parts of it:
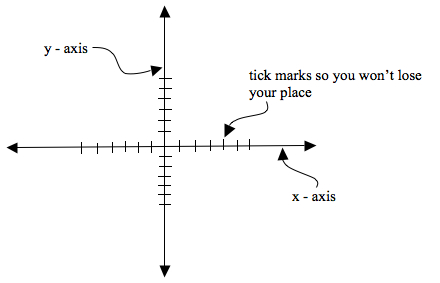
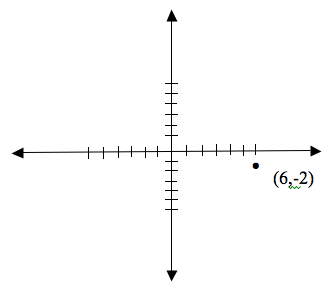
Keeping things in order, when you are given a set of numbers like (6,-2), we have the following:
Parentheses tell us that these two numbers go together to make a single set of coordinates
6 comes first and so matches up with the x, 2 comes second and matches up with y.
So, we go to where we are at 6 on the x and -2 on the y to find the right location of the point like this:
Section 4.1 Exercises
Part A
Section 4.1 Exercises Part APart B
Section 4.1 Exercises Part BPart C
Section 4.1 Exercises Part C
4.2 - Lines
When we solved equations that looked like 3x-2=13, we got a solution like x=5, but what does that really mean? We have followed an algorithm to arrive at the proper location, but the reader is reminded that the whole purpose of manipulating equations is to find numbers for x that we can stick in and make a true statement. If we stick in 5 for x in this equation, we get 3(5) - 2 = 13, which is true. There is no other number which will do this. We call this a solution to the equation.
In that kind of equation we found a number for x that made the statement true, and sometimes we could even guess what would work without really using any formulas or steps. This process becomes a bit helpful when studying the next type of equation:
3x + 2y = 5
In this type of equation there is an x and a y to find numbers for. The solution to this equation will not be a single number as it was in the earlier cases, but a pair of numbers. The answers will look something like (3,-2), which means that we will stick in 3 for x and -2 for y. If you stick those in, the equation becomes:
3(3) + 2(-2) = 5
9 - 4 = 5
Woo Hoo! It works! We found a solution, and we don’t even know what we are doing yet. Let’s see if there is another one. Try the following pairs of numbers in the equation to see if they also work:
| (1,1) | 3(1) + 2(1) = 5 | solution |
| (3,2) | 3(3) + 2(2) = 5 | nope |
| (-1,4) | 3(-1) + 2(4) = 5 | solution |
| (5,-2) | 3(5) + 2(-2) = 5 | nope |
| (5,-5) | 3(5) + 2(-5) = 5 | solution |
If you try all of these, you will realize that some of them work as solutions and some of them don’t. In any case, you should be able to realize that there are a whole lot of solutions; tons of them! One way to get them is to keep guessing. When you get tired of that there is an algorithm that might make things a little easier. If we pick a number for x and stick it in, then we will have an equation that we can solve for y. For example, if we say in this example we want x to be 7, we stick it in to get:
3(7)+2y=5 21+2y=5 2y=-16 y=-8 |
Which means that when x is 7, y will be -8, or in other words, the pair (7,-8) is a solution. What would we get if we made y=9? The equation would be:
3x + 2(9) = 5
Solving for x, we get x= -5, so the pair (-5,9) is a solution.
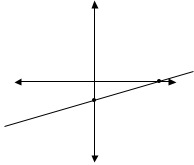
Now we can get so many solutions this way that it doesn’t pose a problem to find one anymore. Since there are so many, the question arises, “Are there any patterns in the solutions to these equations.” Well, of course there are. This is math! The solutions are pairs, which we can stick on a graph. If we plot the ones that we have already found to the problem we are using we get this: (3,-2), (1,1), (-1,4), (5,-5), and (7,-8).
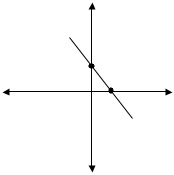
| You will notice that all of the solutions are in a straight line. If we connect them, we get all of the solutions for the equation. It is important to realize that if we draw the line that connects the dots, all of the points on that line are solutions. The problems will simply ask you to graph the line 3x+2y=5, or something similar. | 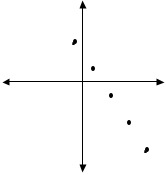 |
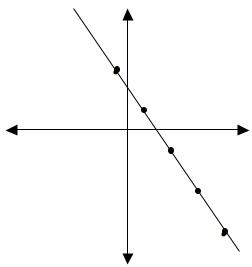 |
The correct answer to “Graph the line 3x+2y=5,” is then the graph at the left. |
For the next one, find four points on the line and then graph it:
y = 14x - 2
x |
y |
|
4 |
when x = 4 we have y = 14(4) - 2 which means y = -1 | |
0 |
when x = 0 we have y = 14(0) - 2 which means y = -2 | |
0 |
when y = 0 we have 0 = 14(x) - 2 which means x = 8 | |
3 |
when y = 3 we have 3 = 14(x) - 2 which means x = 20 |
The table completely filled out looks like this:
x |
y |
4 |
-1 |
0 |
-2 |
8
|
0 |
20 |
3 |
and the graph like this:
 |
Notice that we really only need two points to get the pattern. For convenience, we often select 0 for x, and then 0 for y. When x is 0 the point is on the y-axis. Likewise, when y is 0 the point is on the x-axis. In the previous example, the point (0,-2) lies on the y-axis and is called the y-intercept; the point (8,0) lies on the x-axis and is called the x-intercept. |
An x-intercept happens when y is zero, and a y-intercept happens when x is zero.
Here is another example.
Graph the line 4x + 3y = 8; find the x and y intercepts.
We start by finding the x- and y-intercepts with a table that looks like this:
| x | y |
|---|---|
| 0 | |
| 0 |
Then fill it out by plugging in 0 for x and getting:
| 4(0) + 3y = 8 3y = 8 y = 83 |
When we plug in 0 for y we get:
| 4x + 3(0) = 8 4x = 8 x = 2 |
so we have the table:
| x | y |
|---|---|
| 0 | 83 |
| 2 | 0 |
and the graph:
There are particular kinds of lines that may give you a bit of trouble when you first see them. Your first reaction when asked to graph the line:
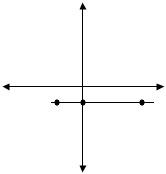
x = 4
is probably something like, “Hey, where is the y?” or, “How do I do that? It looks different.”
Relax; these kinds are actually a bit easier than the other ones. Watch:
| What is x when y is 7? Answer: 4 | The points (4, 7), (4, 0) and (4, -3) are part of the line and help us graph it. |
| What is x when y is 0? Answer: 4 | |
| What is x when y is -3? Answer: 4 |
Do you see how nice that is? Since y is not in the equation it can be anything it wants to be, but x is always 4. The graph is as follows:
 |
Here is the line x = 4; notice that it is vertical and hits where x is 4 |
For future reference you can remember that all equations that only have an x will be vertical.
The other special case that may seem difficult at first looks like this:
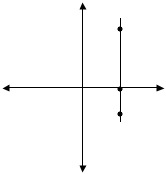
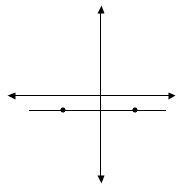
y = -2
But I think you can see that it will be very similar to the previous example:
| What is y when x is 0? Answer: -2 | The points (0, -2), (5, -2) and (-3, -2) are part of the line and help us graph it. |
| What is y when x is 5? Answer: -2 | |
| What is y when x is -3? Answer: -2 |
See how slick that is?! The graph is as follows:
|
Here is the line y = -2; notice that it is horizontal and hits where y is -2. |
All equations with just a y in them will be horizontal lines.
Now that we can graph any lines, there is one particular property of lines that is most useful.
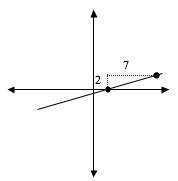
We introduce this by bringing to mind a familiar road sign. This sign warns of steepness, but 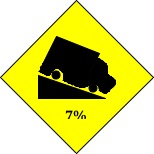 take a look at what it is really saying. 7% means the fraction 7100.
The interpretation of the sign means that the road falls vertically 7 feet for every 100 feet that you travel horizontally. In this way the highway department uses fractions to denote the steepness of roads.
We are going to do the same thing with the steepness of lines. When we have a couple of points on the graph we can find the steepness between them. Here are a couple of examples.
1st Example |
The steepness of the line between point A(-2,1) and B(3,3) is found by taking how much it changes up and down (distance between 1 and 3 = 2) over how much it changes left and right(distance between -2 and 3 = 5). That makes a steepness of 25. The name for steepness is slope, and the symbol is m (as in a mountain). We would write that m = 25. | 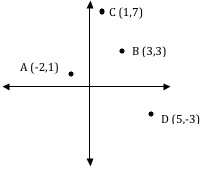 |
|---|---|---|
2nd Example |
The slope of the line through A(-2,1) and C(1,7) would be 6 (the distance from 1 to 7) over 3 (the distance from -2 to 1). We would write m = 63, or in other words m = 2. |
|
3rdExample |
The slope of the line through A(-2,1) and D(5,-3) would be -4 (the distance from 1 down to -3) over 7 (the distance from -2 to 5); m = -47 | |
There are some properties that you should start to see from these examples.
- Bigger numbers for slope correspond to steeper lines.
- Positive slopes will go up as you move to the right.
- (Opposite of #2) Negative slopes will go down as you move to the right.
In the first example we obtained the 2 as the distance from 1 to 3. What operation finds distance? Answer: Subtraction.
Aha! Seeing that, we can start to see a pattern in how to find slopes a little more quickly. Let’s look at those three examples, using subtraction this time:
|
1st Example: |
2nd Example: |
3rd Example: |
|
|---|---|---|---|---|
3-13--2 = 25 |
7-11--2 = 63 |
-3-15--2 = -47 |
Now, see if you can find the slope between two general points:
Point 1 and point 2 with coordinates that we don’t know.We would like to call them both just (x,y), but then subtraction would give us zero. This is a good time to show you how subscripts can be very helpful. We will call point #1
(x1,y1) showing that the x and the y come from the 1st point. Similarly we will call point #2 (x2,y2).
Now you can find the slope just like we did in the previous examples:
m = y2 - y1x2 - x1
Voila! You have just created the formula for finding slope between two points. Practice using it quite a bit until it almost becomes natural. Memorize it!
Sometimes formulas are written in a few different ways. Here are some of the others:
m = y1 - y2x1 - x2 m = ychangexchange m = riserun m = ΔyΔx
They all mean the same thing.
Section 4.2 Exercises
Part A
Section 4.2 Exercises Part APart B
Section 4.2 Exercises Part BPart C
Section 4.2 Exercises Part C
Section 4.3: Graphing Equations with Slope
Okay, now that you know how to graph a line by getting some points, and you know how to find the slope between two points, you should be able to find the slope of a line once you have an equation:
Example: Find the slope and graph the line 3x-4y=2. Well, if we find a couple of points, (2,1) and (6,4), the graph must look like this:
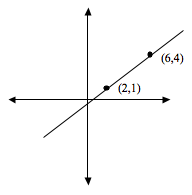 Then finding the slope, we can just use the same method that we have done the other ones we get the slope m = 4-36-2 = 34
Trying this a couple of times on various equations, you might get something like the following:
| Equation: | Slope: |
| y = -2x – 5 | m = -2 |
| y = 37x + 4 | m = 37 |
| y = - 49x – 13 | m = - 17 |
| y = x7 - 2 | m = 17 |
I hope that you kind of see a pattern emerging that you would be able to use as a shortcut. Do you see how the change in y is always the coefficient of x? And do you see that the change in x is always the opposite of the coefficient of y? These equations are all written the same way and have the same pattern for getting the slope without actually figuring it out from a couple of points.
Here is a pattern for another common way of writing lines. Pick out the pattern here:
| Equation: | Slope: |
| 3x – 5y = 10 | m = 35 |
| 2x + 9y = 4 | m = -29 |
| 5x + y = 15 | m = -5 |
| x-3y = 12 | m = 13 |
The pattern here is even easier than the first one. When y is by itself, the slope is simply the number in front of x. No change.
Since these are two very common ways of writing lines, they need comparison.
| Standard Form: - It is written in the form Ax+By = C where A, B, and C are integers (usually). - Intercepts are found by putting in 0 for either x or y so each is relatively easily found as (0, CB) and (CA,0). - Slope is always m = - AB Advantages: It has no fractions. Both x- and y- intercept have same amount of calculation Disadvantages: Minor calculation for y-intercept. Remembering to put the negative sign on the slope. |
Slope-intercept Form: - Written in the form y = mx+b. - m is the slope without any adjustment. - (0,b) is the y-intercept. Advantages: Slope is most easily found. Y-intercept is most easily found. Prepares you for function f(x) notation. Disadvantages: Fractions are often part of the equation. |
Since both of them will be given to you to graph, you should be able to work with both of them. Important note: You should also see that we can change from Standard form into Slope-intercept form (and vice-versa) simply by solving for y. In the example 3x-4y=2, we get:
3x-4y=2
-4y=-3x+2
y= 34x -12
| Standard: 3x-4y=2 | Slope-intercept: y= 34x -12 |
| Slope: m= 34 | Slope: m= 34 |
| y-intercept: (0, -12) x-intercept: (23, 0) |
y-intercept: (0, -12) x-intercept: (23, 0) |
| x-3y = 12 | m = 13 |
They are simply two different ways to write the same equation. There is no difference, except that of convenience. The first way is called standard form, and the second is called slope-intercept form. Again, they are the same line! Every point that works in one will work in the other.
 In any case, you will learn and have practice with both forms. Being able to pick out intercepts and slope from lines will help you to graph them quickly. Having the slope especially makes it a cinch to graph lines. You only need to find one point, then follow the slope to the next point and draw the line. Example:
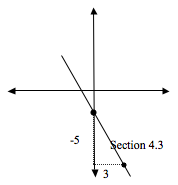
Graph the line and find the slope of y=- 53x - 4
Well the slope is right in front of x, so m= -53
One easy point is to stick in zero for x. We get the point (0,-4). Following the slope, (it is negative, so we will head down as we go to the right) down 5 over 3 and we come to the point (3,-9), and then draw the line.
 Another example:
Graph the line and find the slope of 2x-7y=4 Well the slope is the opposite of 2 over 7, so m=-2-7 = 27 It appears that the easiest point in this one is the x-intercept, so we stick in zero for y and get x=2: (2,0). Following the slope we move up 2 and over 7 to the next point (9,2), and then draw the line.
That covers graphing and finding the slope for the vast majority of equations. As you will recall, there were a couple of special cases where either the x or the y were missing. We now look to find the slope of these.
 We will work two examples of this:
First: y= -2
Remember how to find a couple of points that work: (3,-2) and (-1,-2). It gives us the graph of a horizontal line where y is always -2:
Putting those two points into the formula for finding slope, we get:
m = -2--2-1-3 = 0-4 = 0
which means that all horizontal lines will have a slope of 0.
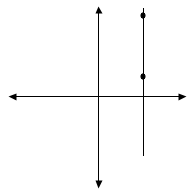 Second: x=5
Remember how to find a couple of points that work: (5,2) and (5,6). It gives us the graph of a vertical line where x is always 5:
Now if we put the points in the slope formula, we get:
6-25-5 = 40 = bad news. (Division by zero is undefined.) Which means that all vertical lines have undefined slope.
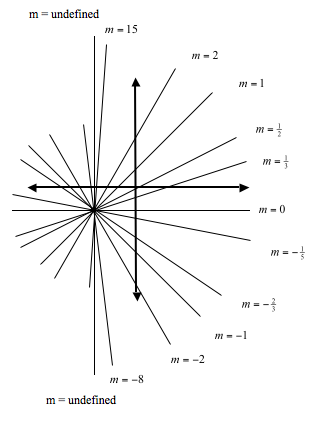 To get a little better feel for slope, we are going to take a little time to look at some slopes. You will notice that the higher the number, the steeper it is. Common sense from that will tell you that a slope of 0 will belong to a line that is completely flat. Also, you should see that since numbers get bigger as the slope gets steeper, the slope of a vertical line would have to be far greater than a billion. On the other hand, numbers get increasingly large in the negative direction for lines that are heading down ever steeper. That means that vertical lines would have to have a slope that is less than negative one billion. Hmmmmmm…. greater than a billion and less than negative a billion at the same time. No wonder that division by zero can’t be done and is undefined.
A word of caution: Since the term “no slope” is interpreted by some to mean zero slope and by others to mean that the slope doesn’t exist, we will simply avoid the term. A vertical line has undefined slope and a horizontal line has a slope of zero.
Now that we can go from the equation of a line to the finding of points, getting the slope and graphing the line, we are going to work on how to go backwards. It really isn’t as difficult as it seems. Since from an equation we can get the slope, we can certainly write an equation from the slope.
Example:
Write an equation of the line that has slope m= 35, and goes through the point (5,-2).
There are two ways to do this. Remember with standard form, the slope is the negative of the first number over the second. In slope-intercept, the slope is right in front of the x when y is by itself.
| Standard | Slope-Intercept |
| Since the slope is 35, we know that an equation would have to be: 3x – 5y = something but what? Ahhh, here is where we use the fact that (5,2) has to work in the equation. If we stick in 5 for x and 2 for y we get: 3(5) – 5(2) = 15 – 10 =5 3x – 5y = 5 |
Since the slope is 35, we know that an equation would have to be: y = 35x+b but what is b? Ahhh, here is where we use the fact that (5,2) has to work in the equation. If we stick in 5 for x and 2 for y we get: 2 = 35(5) + b 2 = 3 + b -1 = b Thus our equation must be y = 35x - 1 |
Again, please note that if you take the standard form and solve for y, you will get the slope-intercept form.
 As a side note on slope:
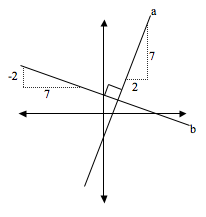
When two lines have the same slope, or steepness such that they never cross, we call these parallel. When two lines meet at a 90 degree angle, it is called perpendicular. Let’s suppose that line “a” has a slope of 72; it is pretty steep and positive. Line “b” will have a similar ratio, but we can see that it is shallow and negative. As we can see from the picture, the slope of “b” is m= - 27. This pattern happens every time that two lines are perpendicular. As a rule: A perpendicular slope is the negative reciprocal. Some people like to think of it that the two slopes will always multiply together to give you -1.
As a special case, can you see what slope would be perpendicular to 0? Since vertical and horizontal are perpendicular, an undefined slope is the answer.
| Equation | Slope | Parallel slope | Perpendicular |
| 3x+2y=7 | m= -32 | m= -32 | m= 23 |
| y = 5x-2 | m= 5 | m= 5 | m= -15 |
| 4x-7y=7 | m= 47 | m= 47 | m= 74 |
| x=-7 | m = undefined | m = undefined | m = 0 |
| y=3 | m = 0 | m = 0 | m = undefined |
Section 4.3 Exercises
Part A
Section 4.3 Exercises Part APart B
Section 4.3 Exercises Part BPart C
Section 4.3 Exercises Part C