Long Run Economic Growth
Section 01: How a Market Economy Leads to Economic Growth
Economic growth is usually defined in terms of an increase in either GDP or per capita GDP. If we see an increase in GDP over time (what some might call economic growth) but do not know what is happening to population growth over time, we do not know for sure if the standard of living is going up or down. Per capita GDP is defined as the gross domestic product divided by the population. Growth in per capita GDP ensures that the GDP is growing at a faster rate than population, and that the standard of living is actually growing. In other words, if a country’s GDP were increasing at a one percent annual rate but their population was increasing at a one percent annual rate also, their per capita GDP would be constant and there would not be any real economic growth. In order for there to be economic growth, the GDP must be growing at a faster rate than the population. Economic growth is generally attributed to improvements in productivity: that is, increasing output as a result of a given level of inputs (think labor and capital) becoming more productive. In this lesson, we will look at long run economic growth. Short run fluctuations in output associated with the business cycle will be considered in the future lessons.
As an example, let’s look at data from the United States. Consider the following table that shows the GDP, the population, and the per capita GDP in six different years:
| Year | GDP (in trillions of $) | Population | Per Capita GDP |
|---|---|---|---|
| 1985 | 4.185 | 237,923,734 | 17,590 |
| 1990 | 5.755 | 249,622,814 | 23,055 |
| 1995 | 7.359 | 266,278,393 | 27,637 |
| 2000 | 9.899 | 282,171,936 | 35,081 |
| 2005 | 12.58 | 295,560,549 | 42,563 |
| 2010 | 14.7 | 308,745,538 | 47,612 |
From 2005 to 2010 there was a 16.85% growth rate in GDP [(14.7-12.58)/12.58], but there was only an 11.9% growth rate in the per capita GDP [(47,612-42,563)/42,563)] because there was a nearly 5% growth in the population as well.
Think About It: Calculating Growth
Calculate the growth in GDP, the population growth, and the growth in per capita GDP from 1995 to 2000 using the data above.
Classical Economic Growth
In the 18th century, classical economists such as Thomas Malthus and Adam Smith taught that growth in the per capita GDP would be transitory. They suggested that if standards of living rose above the subsistence level, families would be enticed to have more children and that population would grow at a faster rate than output, and we would eventually return to a subsistence standard of living. The idea that we cannot grow beyond a subsistence level was crucially linked to the assumption that above-subsistence levels of income would lead to a population boom. Not everyone would concur with this assumption, as we shall see.
Neoclassical Economic Growth
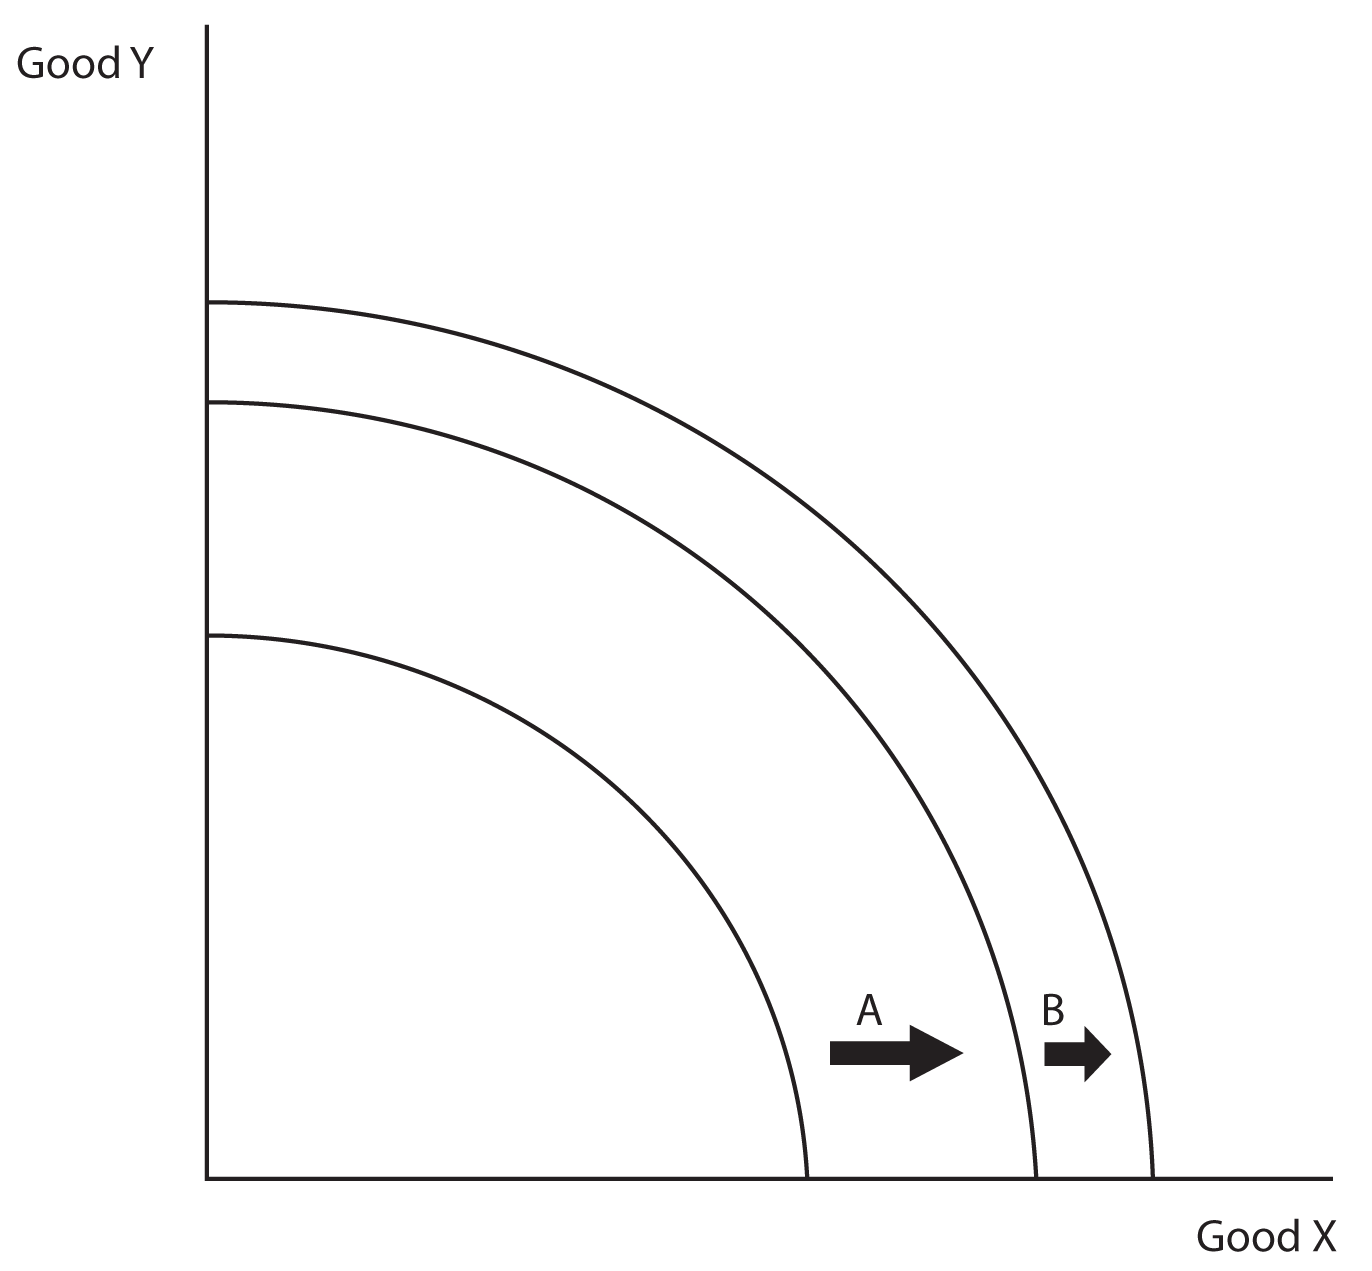
Recall that one of the earliest models that we considered was the model of production, illustrated by production possibility curves. The neoclassical model of production assumes that there is a fixed amount of inputs, that these inputs are allocated efficiently, and that these inputs are transformed by a fixed technology into full production and output. Not mentioned before, but implicit in the model, is that there is a diminishing marginal return to both capital and labor inputs. This model predicts that increasing the amounts of an input, let’s say capital, will cause growth (a shift outward in the production possibilities curve) up to a point. In the graph below, assume that the shift in the production possibility curve shown by the arrow A is due to an increase in capital. Subsequent increases in capital will result in less economic growth (the shift represented by arrow B). This is due to a diminishing marginal productivity of capital. Beyond some point, usually referred to as “steady state,” the only way to achieve additional growth is improving technology. Per capita increases in GDP will only persist if improvements in technology persist. Otherwise, diminishing returns to capital will eventually limit growth.
This same idea can be shown using a production function where Labor input is measured on the horizontal axis and Real GPD on the vertical axis. In the neoclassical model, if we increase the amount of capital without increasing technology, the growth in the economy is eventually limited. Notice that the production function shifts outward by less with each capital increase. Eventually, a given increase in capital would not shift the production function at all. Shifts upward in the production function can only continue unabated if technology is allowed advance without limit.

The neoclassical model does not predict that a population explosion will accompany increases in the standard of living. Increases in standards of living actually have very little impact on population growth, because it tends to decrease birth rates and decrease the death rate. The lack of a population boom permits per capita GDP to rise almost indefinitely, as long as technology advances.
An Example
Are you richer than the richest American of all time? This is a serious question asked by economist Greg Mankiw in Principles of Economics. The oil entrepreneur John D. Rockefeller lived from 1839 to 1937 and generated some $200 billon of wealth. If you could have $200 billion on the condition that you could only spend money on the types of things that Rockefeller could have spent his money on in the 1890s, would you take it? In other words, would you be willing to give up all modern conveniences for the rest of your life for $200 billion? 1890 predates any significant distribution of electric power—you would not be able to purchase electrical appliances or electronics like telephone, internet, air conditioning, refrigerator, or even electric lights. What happens if you get sick or decide to have a child? Imagine a hospital without electricity or even antibiotics. Most Americans would rather live the way they do now than have the 1890 lifestyle of the richest American ever.
How is it that a relatively poor American is so much better off today than the richest American ever was in 1890? The key is technological change. Technological change not only gives us more options as consumers, it makes us more productive as workers. Workers today can produce more output in an hour of work than Americans a century ago or even a couple of decades ago. Consider for instance the standard of living of Daniel Boone who lived from 1734 to 1820. His father was a nail maker. When young Daniel first started making nails he could only make 50 nails after a long day of hard work. His father could make 200 nails in a long day. If you had 200 nails to show for a hard day’s work, what would you be able to exchange the nails for? You may not even be able to buy something off the dollar menu at a fast food restaurant with the money you could get in exchange for 200 nails. This is why workers in 19th century America, even in many cases young children, worked very long hours to supply just the bare necessities and had a life expectancy at birth of about 36 years. What would have happened had young Joseph Smith, Jr., been forced to go to school rather than help the family in the fields? The technological reality of the day was such that fathers like Joseph’s were not productive enough to support a large family single-handedly. Today, workers in the nail industry are able to make many hundreds of thousands of nails working less hours in the day than Daniel Boone. The modern nail makers work fewer days of the year and are able to afford a modern house, more and nicer clothing, automobiles, and modern conveniences.
Return to the course in I-Learn and complete the activity that corresponds with this material.
Section 02: The Role of the Entrepreneur in Economic Growth
When we look across the world we see that in societies where technology has been adopted and where the workers have the educational levels necessary to use technology, standards of living are high. In areas in the world where technology is not used and where the workers are by and large uneducated, most people live in poverty. If technology is so important, why is it that not all nations adopt technology? The implementation of technology requires a risky expenditure of time and money. We call those that take the risks necessary to bring workers and capital (i.e., tools, machinery, plants, and equipment) together to create jobs and wealth entrepreneurs. In countries with entrepreneurs we see implementation of technology and wealth creation, whereas in countries without entrepreneurs, we see stagnation.
So the question really becomes “Why do some countries have entrepreneurs while others do not?” The answer lies in the fact that rules governing economies differ substantially around the world. Some economic systems create an environment where creativity and wealth creation is rewarded, and entrepreneurship flourishes. Under other economic systems, the rules are road blocks for entrepreneurs and crush creativity. The system of rules in which entrepreneurs can flourish, and which results in technological, is often called economic freedom. Economic freedom is created by a system of rules where property rights are protected and the rule of law prevails. Countries with economic freedom have low tax rates, low amounts of regulation, and very little corruption.
In countries without economic freedom, markets and entrepreneurship are hampered. In many of these countries, the standard of living is much like it was in America during the 18th century. In many cases, the lack of property rights, lack of rule of law, and high corruption make entrepreneurship impossible. To start a business in a country like Bolivia, many thousands of dollars of bribes must be paid out to corrupt government bureaucrats. After the business is started, there is a constant risk of government policy destroying the business. In Venezuela, President Hugo Chavez has been nationalizing businesses. Nationalization is government takeover of private companies. For instance, Chavez recently nationalized the hotel industry—in effect, stealing the hotels from the private owners and placing the hotels under the management of government bureaucrats. Most small businesses in countries where small business is encouraged, like in the United States, fail within the first five years. If starting a business is risky in a country where private property rights and the rule of law is respected, imagine how difficult entrepreneurship is in a country without economic liberty? It is no wonder why many countries of the world languish in poverty for generation after generation. The legal system crushes the initiative of their entrepreneurial citizens.
The effect that rules and economic freedom can have on economic outcomes is powerfully illustrated by the following image (see Image 1). This picture shows students in Africa studying under street lights at Guinea’s G’bessi Airport. They are studying at the airport because they are not able to obtain electric light at their homes. However, many of these students own cell phones. Economist Paul Romer asks, why is it that these students have “access to a cutting edge technology like the cell phone but [do not] have access to a 100-year-old technology for generating electric light in the home?” His answer: rules. The rules governing entrepreneurs providing cell phone service in Africa provide entrepreneurs with the incentives they need to take the risks and expend the resources involved in providing the service, whereas the rules governing electric power generation impose road blocks.[1]

|
An Experiment in the Form of a Bet
When entrepreneurs are given the economic freedom they need, the invisible hand guides profit-driven entrepreneurs to solve problems and increase standards of living. Imagine believing in the invisible hand enough to bet $10,000 on it. This is exactly what economist Julian Simon did. In 1980, he challenged Paul Ehrlich, a radical environmentalist, to a public $10,000 bet. Ehrlich was the author of a controversial book, The Population Bomb, in which he argued that mankind was facing a catastrophic increase in the world’s population. He believed that dramatic increases in the world population would outstrip the world availability of natural resources and food supply. This would lead to dramatic increases in natural resource prices, food prices, and mass starvation. The book was a popular success in the 1970s and 1980s.
Julian Simon believed that, rather than going up, the prices of most natural resources would actually go down, suggesting that they were becoming economically less scarce rather than scarcer. Simon asked Ehrlich to pick any 5 metals that he believed the world would be running out of. If there really was a critical shortage of the metals, the price of each would become very high. Simon offered a wager of $10,000 that rather than going up, the combined price of the metals would actually go down. Ehrlich was not willing to bet $10,000 so they agreed to a bet of $1,000. Ehrlich consulted with other scientists and they picked out 5 metals for which they believed the price would go up in the next ten years as the world population growth outstripped the availability of the resource. In 1990, when the bet expired, rather than going up, the price of each of the metals had actually gone down.
How is it that Simon was able to be so confident that the natural resource prices would go down over the ten years? Simon believed that the invisible hand would guide entrepreneurs to solve problems in the parts of the world where economic freedom flourishes. High prices cause pain for consumers. High copper prices, for instance, frustrate plumbers, telephone companies, and electricians who must use copper in their businesses. If an entrepreneur can find a good alternative to copper and start a business providing consumers with it, he can make a large profit. In the case of copper, as copper prices went up, entrepreneurs started companies making fiber optic cables, which replaced copper wire in some applications in the communications industry. Entrepreneurs have also started companies making plastic pipes that plumbers can use instead of the more expensive copper pipes. As copper is replaced by alternative products, it becomes economically less scarce and the price goes down.
An entrepreneur can earn significant profits by identifying the problems of others that he can solve. The greater the pain, the more the consumer is willing to pay the entrepreneur to solve the problem. High prices can cause consumers significant pain. The entrepreneur that finds a good substitute to the high priced resource not only earns a high profit, but solves the consumer’s problem, and by decreasing demand for the high priced resource, causes the price of the resource to go down. In this way, the invisible hand guides the profit-seeking entrepreneur to solve critical problems. For example, it was during the high gas prices of the 1970s that cars became substantially more fuel efficient. Economists have found that when energy prices are high, air conditioners become more energy efficient. When energy prices are relatively low, entrepreneurs focus on making air conditioners cheaper to produce and purchase, rather than more energy efficient. Since profits are found by solving problems, the technological change that drives economic growth is targeted in ways that do the most good.
Ehrlich not only believed that as world population increased that natural resource and food prices were going to go up, but that the value of human labor would go down and that standards of living would decline until mass starvation became a reality. Simon points out that in countries with economic freedom, the complete opposite has occurred. As new technology is developed, workers become more productive and their wages actually go up—their standard of living improves. Simon characterized human labor as the ultimate resource. When left free, entrepreneurs solve problems, improving our standard of living and actually increasing the value of human labor. Rather than replacing human labor, new technology gives workers the opportunity to be more productive if they acquire the knowledge and skills needed to use the new technology.
Section 03: Economic Growth in the United States
The technological change of the 19th and 20th centuries is unique in world history. As we discussed in the introduction, not much was invented before the 1800s. Economists believe that the world changed sometime between 1820 and 1830. [2] Joseph Smith’s First Vision took place in 1820 and the Church was restored in 1830. The US Constitution was critical to the dramatic technological change that began in the early 19th century. It created secure property rights so entrepreneurs could keep the fruits of their labors. It created rule of law, making it impossible to enact sudden radical changes in the legal system that would cause greater risk and uncertainty for entrepreneurs. It limited the federal government’s ability to intervene in the economy. Through the commerce clause, the Constitution created a large landmass where trade was able to freely flow. In short, the US Constitution created economic freedom.
Modern prophets have taught that the establishment of the US Constitution was necessary for the “marvelous work and wonder” that is the restoration of the gospel (cite). In fact, the continuation of liberty is essential for us to continue to build God’s Kingdom upon the earth (cite). Without freedom, especially religious freedom, God’s servants would not have had the freedom to restore and preach the gospel. The prophet Joel in the Old Testament prophesied that in the last days the Lord would pour out His spirit upon all flesh (Joel 2: 28). Joseph Fielding Smith taught that one of the manifestations of Joel’s prophecy is the remarkable advance in technological and scientific innovation, uniquely associated with the last days (cite). This technological change greatly facilitates the spread of the gospel. The 15th century invention of the movable type printing press enabled the printing of the Bible for the common man. Satellite and internet technology enables people worldwide to listen to modern prophets during the General Conference of the Church. By guaranteeing liberty, the US Constitution gave Joseph Smith and others the freedom needed for the restoration of the gospel. It has also given entrepreneurs the freedom to develop technology that improves our standard of living and facilitates the spread of the gospel. As the “just and holy principles” of the Constitution have been exported to the rest of the world, both the gospel and economic progress have followed.
Table 1 puts the growth of the United States economy into historical perspective. It shows the United States standard of living in various years and compares them with the standard of living of countries across the world in 2005. GNP per capita is used to measure the standard of living. [3] It is the market value of the final goods and services produced by the citizens of a country in a given year per person. In 2005, the United States had the 6th highest standard of living in the world. This is remarkable, considering that countries with higher standards of living are much smaller and have relatively less diverse populations with less immigration. For example, the top-ranked country, Luxemburg, has a population of just over half a million people, which is comparable to a mid-sized city in the United States.
| Rank | Country | GNP per Capita (2005 $) |
|---|---|---|
| 1 | Luxembourg | 65,602 |
| 2 | Norway | 59,768 |
| 3 | Switzerland | 54,925 |
| 4 | Denmark | 47,363 |
| 5 | Iceland | 46,655 |
| 6 | United States | 43,743 |
| 7 | Bermuda | 41,875 |
| 8 | Sweden | 41,042 |
| ... | ||
| 17 | Belgium | 35,712 |
| 18 | Germany | 34,577 |
| United States in 1989 | 32,933 | |
| 19 | Canada | 32,933 |
| 20 | Australia | 32,170 |
| ... | ||
| 38 | Qatar | 18,212 |
| 39 | Gibraltar | 17,500 |
| United States in 1960 | 17,483 | |
| 40 | Andorra | 17,468 |
| 41 | Slovenia | 17,352 |
| 42 | Cyprus | 17,081 |
| 43 | Taiwan | 16,764 |
| United States in 1945 | 16,459 | |
| 44 | Portugal | 16,164 |
| 45 | Macau | 15,413 |
| ... | ||
| 65 | Tokelau | 10,000 |
| 67 | Barbados | 9,741 |
| United States in 1929 | 9,686 | |
| 68 | Guadeloupe | 9,183 |
| 69 | Estonia | 9,107 |
| ... | ||
| 139 | Micronesia | 2,252 |
| 140 | Tonga | 2,157 |
| United States in 1840 | 2,126 | |
| 141 | Western Samoa | 2,108 |
| 142 | Myanmar | 2,039 |
| ... | ||
| 145 | China | 1,736 |
| ... | ||
| 157 | Egypt | 1,255 |
| 158 | Azerbaijan | 1,241 |
| 159 | Honduras | 1,192 |
| United States in 1775 | 1,181 | |
| 160 | Sri Lanka | 1,162 |
| 161 | Angola | 1,087 |
| ... | ||
| 170 | Nicaragua | 906 |
| 171 | Bhutan | 871 |
| United States in 1710 | 866 | |
| 172 | Ivory Coast | 843 |
| 173 | Moldova | 754 |
| 174 | East Timor | 749 |
| 175 | India | 724 |
| ... | ||
| 223 | Democratic Republic of the Congo | 120 |
| 224 | Burundi | 96 |
The table shows that today the US economy produces over 4.5 times as many goods and services per person than it did in 1929. Imagine consuming about 1/5 as many goods and services as you do today. This gives you an idea of how much different life was in 1929. Add to this the fact that in 1929, the goods and services produced were very different from today’s: no cell phones, color television, or jet airplanes. Today, the US economy produces over 20 times as many goods and services per person as it did in 1840. The US standard of living in 1840 was comparable to Tonga’s standard of living today. The output per person of the US economy at the time of the nation’s birth was comparable to poverty-stricken nations of today. Output per person in the US increased on average by 2.1 percent each year during the second half of the 21st century. At this rate, the amount of goods and services produced per person each year doubles about every 33 years.
Conclusion
The only instances in recorded history where man has been able to escape the poverty that has typified his existence of most throughout history were societies where the free market system has been implemented. The Declaration of Independence and the United States Constitution were economic miracle documents. The Declaration of Independence expressed the moral philosophy that “Men … are endowed by their Creator with certain unalienable Rights, that among these are Life, Liberty, and the Pursuit of Happiness.” The Constitution established rule of law wherein these unalienable rights found protection. By guaranteeing to man the God-given right to private property, the agency of man is protected, and a free market economy is created. The remarkable economic progress of the United States and other countries that have adopted similar governmental systems is the result of the free market system. Ultimately, prosperity is obtained by nations as they keep the commandments of God. [5] We must not only respect the rights of others, but we must serve God by caring for and empowering those that are less fortunate. “Behold, this is a choice land, and whatsoever nation shall possess it shall be free from bondage, and from captivity, and from all other nations under heaven, if they will serve the God of this land, who is Jesus Christ.”[6] “[W]hen ye are in the service of your fellow beings ye are only in the service of your God.”[7]
Return to the course in I-Learn and complete the activity that corresponds with this material.
Notes
- ^ “Paul Romer’s Radical Idea: Charter Cities,” (TEDGlobal 2009), http://www.ted.com/talks/paul_romer.html
- ^ Bateman, Merril J., “Nothing Shall Be Withheld.” BYU-Idaho Devotional, May 22, 2007.
- ^ GNP is a measure of the market value of all the final goods and services produced by citizens of a country in a given year. GNP per capita is calculated by dividing GNP by population. So, GNP per capita is the market value of all the final goods and services produced per person. GNP is a measure of how much the overall economy produced while GNP per capita is a measure of how much the economy produced per person. The historical GNP per capita values have been adjusted for inflation so all of the GNP values are comparable in 2005 dollars.
- ^ This table shows GNP per capita by country for 2005 and GNP for the United States for select earlier years in 2005 dollars. This table is an updated version of Table 1.2 in Attack, Jeremy and Peter Passell. A New Economic View of American History, 2nd ed. (New York: W. W. Norton, 1994). See http://www.studentsoftheworld.info/infopays/rank/PNBH2.html for complete 2005 ranking by GNP per Capita.
- ^ Alma 36:1, 30.
- ^ Ether 2:12.
- ^ Mosiah 2:17.