Section 01: Elasticity -- Beyond Supply and Demand
Total Revenue
Why do move theaters often have empty seats? Would they generate more revenue by lowering the price and selling more tickets? How responsive are movie goers to a change in the price? The answer to these questions are found using elasticities.
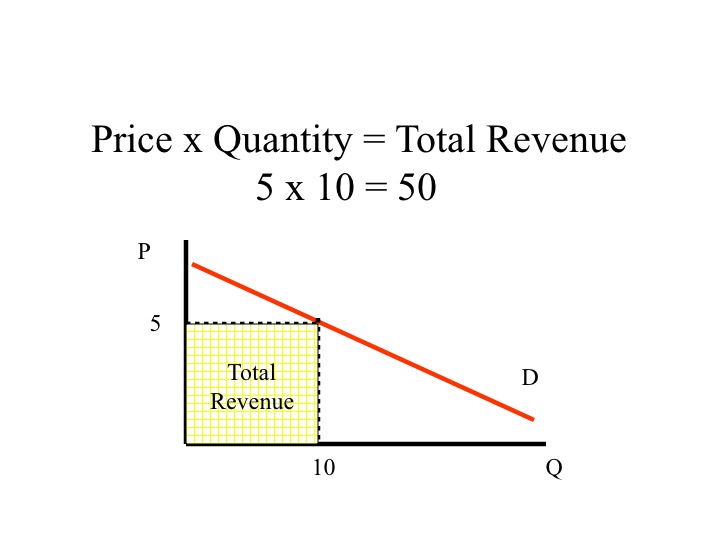
A firm’s profit is determined by taking the total revenue minus the total cost. Total revenue is equal to the price each unit sells for times the quantity or number of units sold. We will focus on total revenue in this section and leave the discussion on costs for later.
One of the key decisions in business is determining what price to charge. We know from the law of demand, that as the price increases (decreases) the quantity demanded decreases (increases), but the question is by how much? Does total revenue increase or decease as we raise or lower the price? The answer is, as is often the case in economics, it all depends.
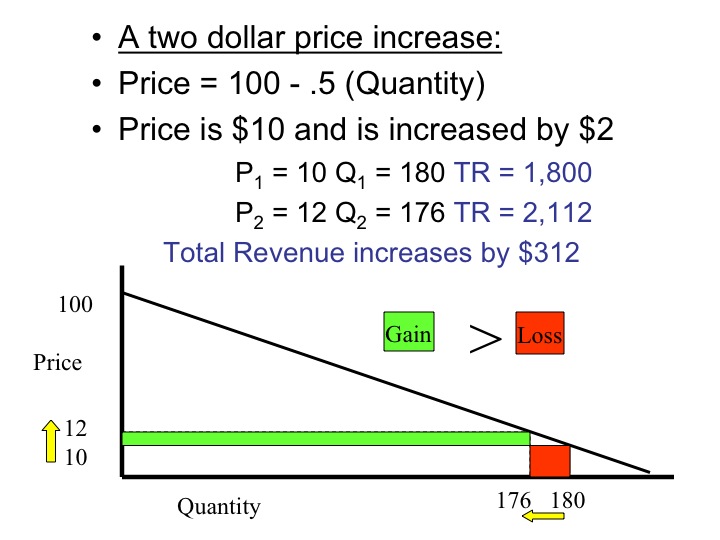
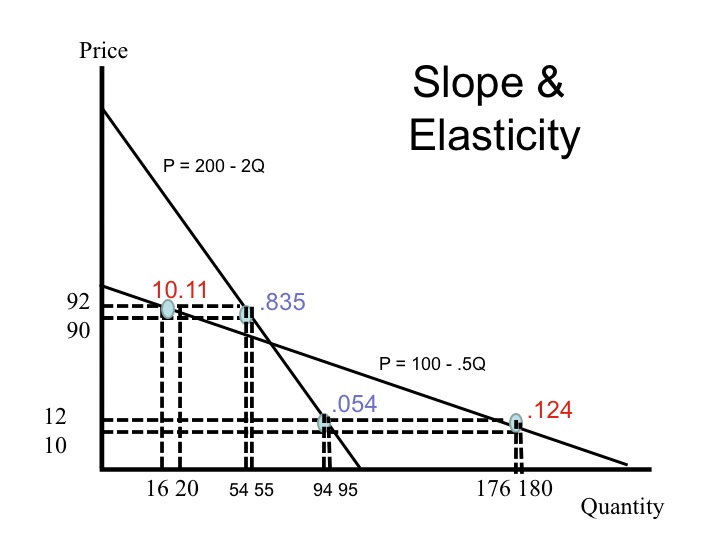
Let’s assume that the demand for a given product can be represented by the equation, price = 100 - .5(quantity). If the current price is 10 dollars and the quantity demanded is 180, then a two dollar increase in the price reduces the quantity demanded by four units. Even though four units less are sold, the additional two dollars per unit sold increases the total revenue.
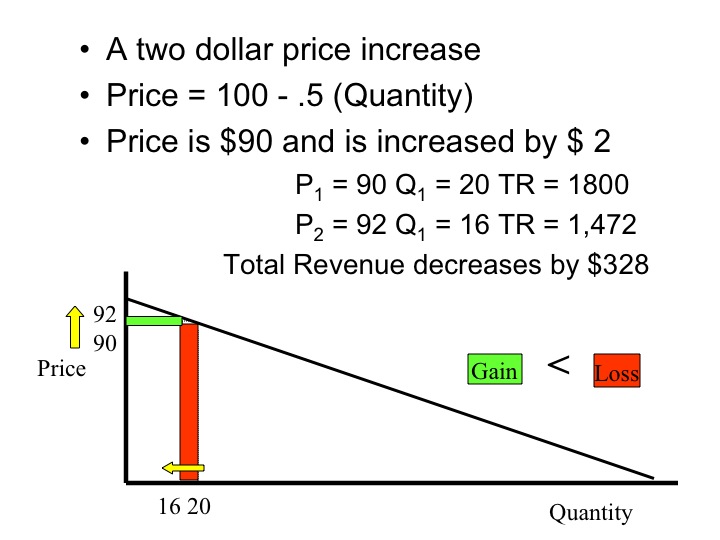
If the price is $90, the quantity demanded is 20. Raising the price by two dollars decreases the quantity demanded by four units. In this case, the total revenue would decline when the price is increased.
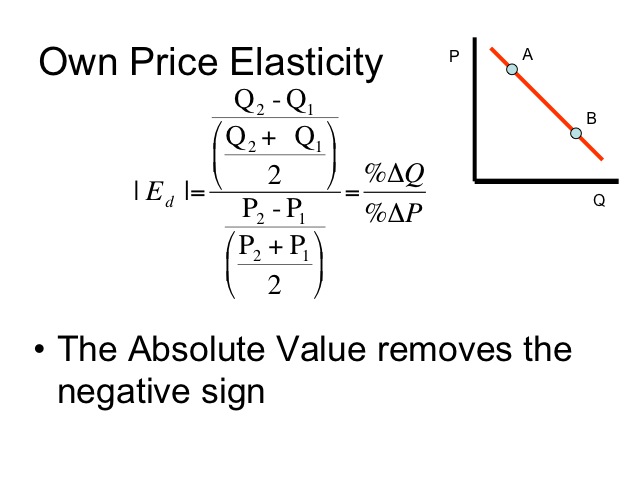
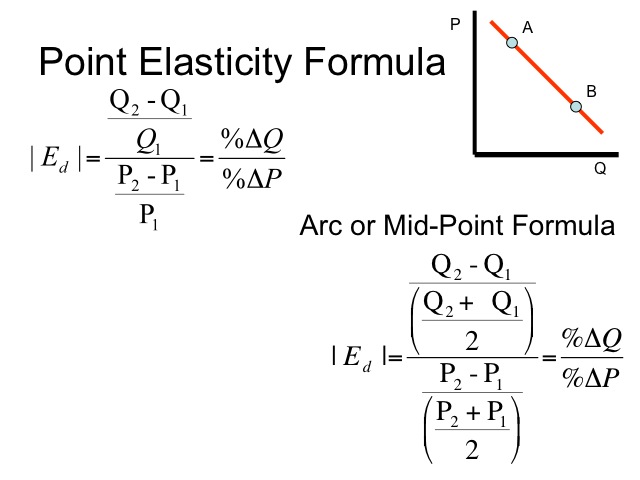
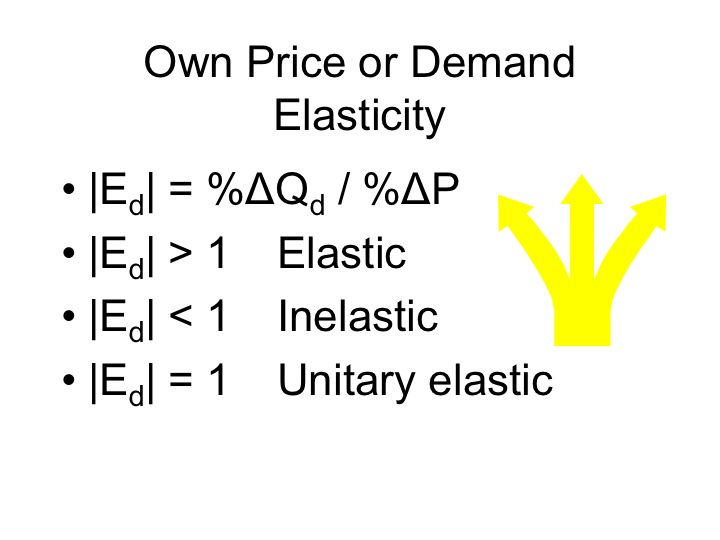
Own price or demand elasticity measures the percentage change in quantity demanded divided by the percentage change in the price of the good. Due to the law of demand, the sign will always be negative, so it is common to consider only the absolute value when analyzing the own price elasticity.
Typically we compute the percentage change using the original value. For example, if the price increases from $2,000 to $2,200, then the percentage increase in the price is the change ($2,200 - $2,000) divided by the original amount ( $2,000) or a 10 percent increase.
However, when we compute the elasticity over a range, say from A to B, we use the average quantity and average price in the denominators. The reason for this convention is that we want the elasticity to be the same over the range regardless of whether we move from A to B or from B to A and using the average in the denominator for percent changes will ensure this. Using the averages is known as the arc or mid-point elasticity formula.
Point elasticity is useful for relatively small changes in price or quantity, and is particularly beneficial when using calculus. However, when using the point elasticity equation, it makes a difference if you go from A to B or from B to A. Since this is a principles course, we will be using the arc elasticity equation instead of the point elasticity.
If something is elastic it is responsive, flexible, or readily changed. A rubber band is elastic and with little force it easily stretches. A chain on the other hand is rigid and changes very little when pulled. In the context of price elasticity of demand, the price change is comparable to the force applied to a rubber band or chain and the change in quantity demanded is comparable to the stretch. When consumers are relatively responsive to a price change, we say that demand is elastic. When the change in quantity demanded by consumers is relatively small in response to a price change, we say that demand is inelastic. When looking at the demand of goods or services, what are the factors that determine how much the quantity demanded changes as the price changes?
If the percentage change in quantity demanded is greater than the percentage change in price, the elasticity is greater than one and the good is classified as elastic, meaning the percentage change in quantity demanded is relatively responsive to the percentage change in price. An elasticity of demand less than one is classified as inelastic, meaning the percentage change in quantity demanded is relatively unresponsive to the percentage change in price.
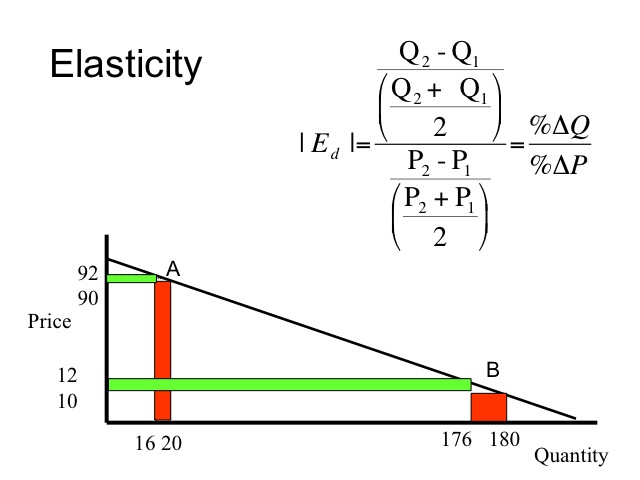
Elasticity measures the percentage change in quantity demanded divided by the percentage change in price. At a relatively high price, the percentage change in price is relatively small while the percentage change in quantity demanded is relatively large. For example, at A, the percentage change in price (2/91) is two percent while the percentage change in quantity demanded (4/18) is 22 percent. Thus in region A of the demand curve, the demand is elastic.
At a relatively low price, the percentage change in price is relatively large while the percentage change in quantity demanded is relatively small. At B, the percentage change in price (2/11) is at 18 percent while the percentage change in quantity demanded (4/178) is two percent.
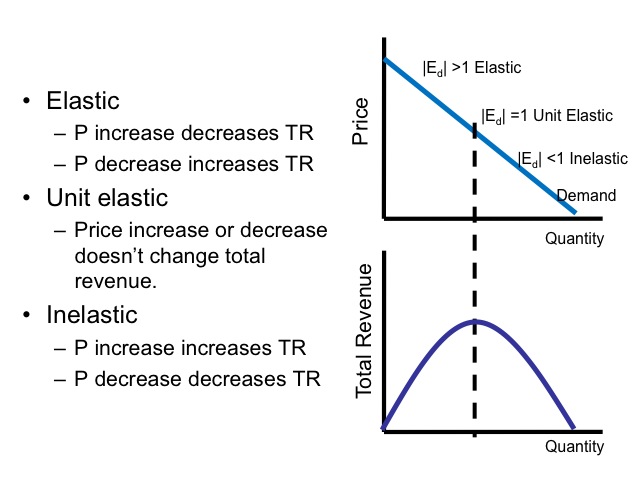
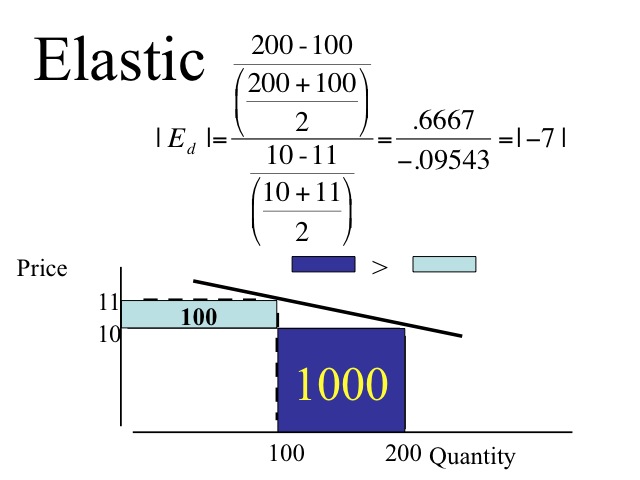
As you may have expected, there is an elastic, unit elastic, and inelastic portion along a linear demand curve. These regions correspond directly with how Total Revenue changes with changes in price. In the elastic region, the percentage change in quantity demanded is greater than the percentage change in price, so raising the price in this region of the demand curve will decrease total revenue while lowering the price increases total revenue.
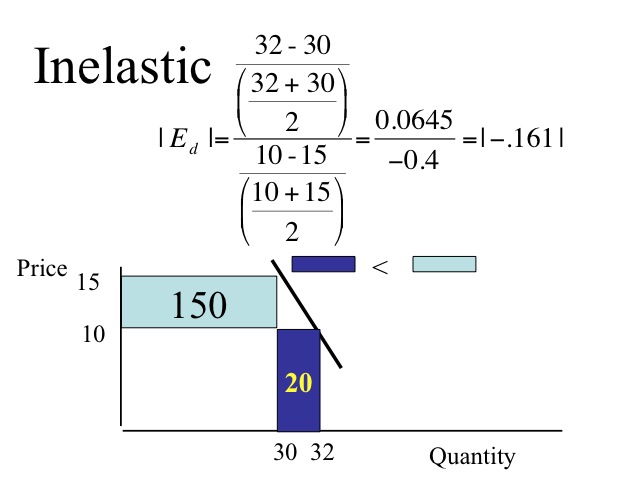
On the other hand, in the inelastic region, a one percent change in the price results in a less than one percent change in the quantity demanded. A price increase will therefore increase total revenue while a price decrease will decrease total revenue.
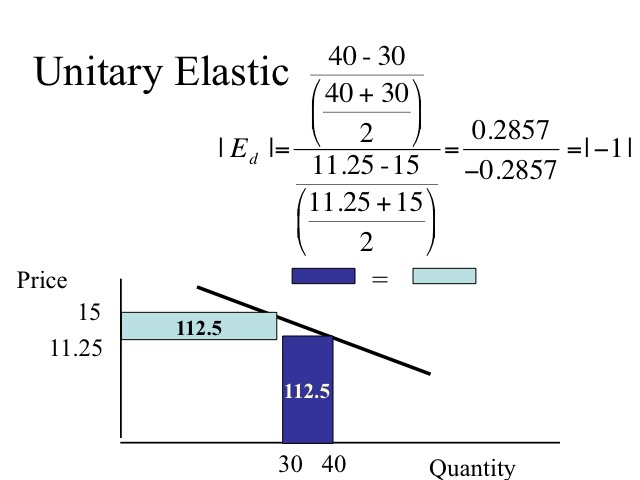
Finally, when the percentage change in quantity demanded is equal to the percentage change in price, demand is said to be unit elastic. In this case, a price increase or decrease does not change total revenue.
We have seen that elasticity changes along a linear demand curve. But it is also true that the slope of a demand curve will have an impact on the elasticity of demand over the entire range of a demand curve. When comparing demand curves for different products, it is common to compare them in terms of elasticities when prices change over the same range. That is, how responsive will the quantity of one product compare to that of another product when prices change the same amount? When making such comparisons, a steeper slope reflects a more inelastic demand while a flatter or more horizontal slope reflects a more elastic demand. Now we must be clear, the slope of a demand curve, in and of itself, does not reflect the elasticity - it will change along the curve and to know its actual value, we need to look at the percentage changes. However, we can be certain that for comparing demand curves with different slopes, a steeper slope reflects a more inelastic demand while a flatter or more horizontal slope reflects a more elastic demand (using the same price range for both).
For an elastic good, a one percent change in the price results in a more than one percent change in quantity demanded. Since the percentage change in quantity demanded is greater than the percentage change in price, raising the price of an elastic good will decrease total revenue while lowering the price of an elastic good increases total revenue. In our example, a one percent decrease in price, results in a seven percent increase in the quantity demanded. Restaurant meals, foreign travel, and name brand products, such as a particular brand of a vehicle or shoes have elastic demands.
For an inelastic good, a one percent change in the price results in a less than one percent change in the quantity demanded. A price increase for an inelastic good will increase total revenue while a price decrease for an inelastic good decreases total revenue. Salt, toothpicks, matches, gasoline, and physician services are examples of goods or services that have an inelastic demand.
If a price increase or decrease does not change total revenue the good or service is said to be unit elastic. The percentage change in quantity demanded is equal to the percentage change in price.
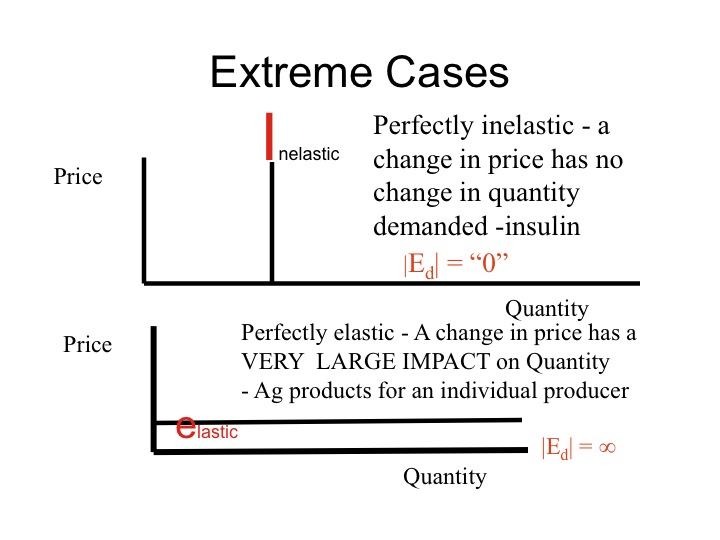
Two extreme cases are perfectly inelastic and perfectly elastic goods. Although these cases are extremely rare, they provide some additional insight. If the quantity demanded doesn’t change at all when the price changes then the elasticity of demand is zero and the demand curve is vertical. When an individual is insulin dependent and consumes the same amount of insulin each day regardless of the price, her demand would be perfectly inelastic resulting in a vertical demand curve. A helpful hint is to remember that I is a tall letter so the demand curve would be vertical. Another example would be a drug addict that consumes the same amount of the drug regardless of the price. Perfectly inelastic demand has a elasticity of zero while inelastic demand is anything less than one.
The other extreme is a perfectly elastic demand curve which gives a horizontal demand curve. An potential example would be an individual grain farmer in a competitive market that can sell all that he can produce at the going market price. But if he tries to raise the price, the quantity demanded for the good goes to zero. A perfectly elastic demand has an elasticity that is infinite while elastic demand is anything greater than one.
Determinants of the Elasticity of Demand
Certain factors can explain why the elasticities differ when comparing demand curves; these factors are called determinants of the elasticity of demand.
1. Available close substitutes
The greater the number of close substitutes that are available for a good, the more elastic it becomes. If there are many bread stores in the city and one bread store raises its price, the quantity demanded decreases since there are many other stores producing a similar product. On the other hand if an individual is on insulin or another particular type of medication for which few close substitutes exist, then an increase in the price results in very little change in the quantity demanded of the good.
2. Percent of Income
The percent of income spent on the good influences the elasticity of demand. Think of your annual expenditures on toothpicks or pencils. If the price of those items increased, by say 20 percent, the quantity demanded would likely decrease very little due to your annual expenditures on the item. Spending $.60 instead of $.50 each year on toothpicks doesn’t dramatically change the quantity demanded. However for those items that make up a greater portion of our income, we are more responsive. If the price of a car increases by 20 percent, the quantity demanded is likely to decline significantly. In general, the greater percent of income spent on the good the more elastic it becomes, all else held constant.
3. Luxury or necessity?
Those items that are a necessities in life are more inelastic than items that are a luxury. Food in general, salt, and life saving medical care are examples of necessities and have lower price elasicities than luxury items such as: jewelry, yachts, or vacation travel.
4. Time period
The longer the time period, the more elastic a good becomes as more substitutes become available. If the price of gas doubled, car owners would still need to buy gas. But in time, they may choose to trade their larger vehicle in for one that is more fuel efficient or uses an alternative fuel, or even choose to move to a different apartment so that they are closer to work or able to use an alternative methods of public transportation such as a subway, train or bus line. In the short run, the elasticity of gas is estimated to be .2 while in the long run is .7 (http://www.mackinac.org/1247).
5. Market definition
The last determinant of own price elasticity is the market definition. The broader the definition the fewer number of close available substitutes exist. If a single gas station in town raises its price, there are several other gas stations in town that sell a very similar product, thus the gas at a particular station tends to be elastic. However, if we look at the entire market for gas, there are few substitutes and the own price elasticity is inelastic.
Back to our original question, why do movie theaters typically have empty seats? Would they increase revenue by lowering the price? It turns out that in general movies elasticity of .9 (|Ed| = .9) ,which is close to unit elastic but on the inelastic side. Decreasing the price by ten percent would only increase the quantity demanded by nine percent leading to a drop in total revenue.
Practice
Now answer the following questions using the data on the table below. Try not to peek at the answers until after you've answered the questions on your own.
1. List the determinants of demand elasticity.
2. Compute the total revenue for each and determine if the good is elastic or inelastic.
| Good A | |
| Price $5 | Quantity 15 |
| Price $6 | Quantity 10 |
| Good B | |
| Price $5 | Quantity 50 |
| Price $6 | Quantity 48 |
3. Compute the elasticity of demand.
Q1= 4 Q2 = 5
P1= $3 P2 = $2.25
Answers
| Good A | Price goes up, revenue goes down – elastic |
| Price $5 | Quanitity 15 = 75 |
| Price $6 | Quantity 10 = 60 |
| Good B | Price goes up, revenue goes up – inelastic |
| Price $5 | Quantity 50 = $250 |
| Price $6 | Quantity 48 = $288 |
Elasticity of demand / Own Price Elasticity
Q1= 4 Q2 = 5
P1= $3 P2 = $2.25
.2222/-.2857143 = |-.77| < 1 Inelastic
A 1% increase in price leads to a .77% decrease in quantity demanded.
Section 02: Other Elasticities
Other Elasticity Measures
In addition to the own price or demand elasticity, there are other elasticity measures that provide additional insights. These include the elasticity of supply, cross-price elasticity and income elasticity.
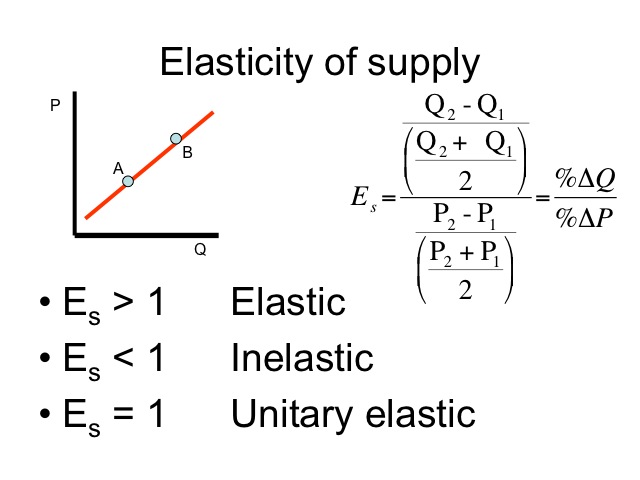
The elasticity of supply is the same basic formula as the demand elasticity, but looks at the percentage change in quantity supplied instead of percentage change in quantity demanded. The measure looks at the responsiveness of producer to changes in the price of the good produced.
The law of supply states that as the price increases (decreases) the quantity supplied increases (decreases). Since the relationship between price and quantity supplied is positive or direct, we don’t need to take the absolute value. The elasticity of supply is compared to one and has a similar interpretation to that of the elasticity of demand.
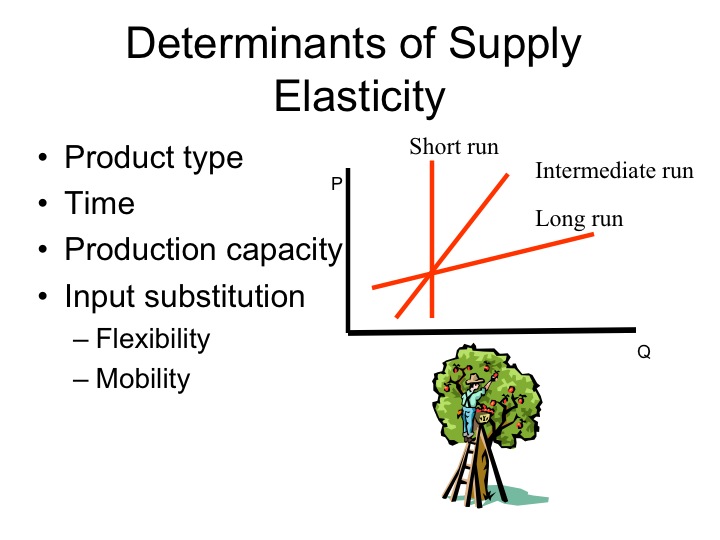
The following list contains the main determinants of supply elasticity.
1. Product type
2. Time
3. Production capacity
4. Input substitution -- Flexibility and Mobility
The type of product impacts how quickly a producer is able to respond to a change in price. A manufacturing firm may be able to quickly adjust production levels with only minor adjustments in the equipment while other products such as apples require several years to establish a new orchard. Since child care services requires relatively few skills compared to the those of a physician, the supply elasticity of child care services is more elastic than that of physician services. To provide more physician care would require years of medical training. We will discuss later in the course a condition where the labor supply curve becomes backward bending. A physician making a very large income may actually choose to work fewer hours if they receive a higher income per hour.
Time is a key determinant of supply. In the case of apples and some other agriculture products, the immediate elasticity of supply is very inelastic, i.e., there are only so many apples available for sale today. However, with time producers are able to respond to the increase in price, manufacturing firms can build new facilities, farmers can plant additional acres to the particular crop. Thus in time, the elasticity of supply becomes more elastic.
If a firm is already operating at full capacity, then to increase supply would require building additional facilities and purchasing new equipments. A firm that is operating at below full capacity, can respond to a price increase quicker than a firm that is already at full capacity.
Another determinant in the elasticity of supply is input substitution. As the price of a good increases, how easily can inputs that were used in the production of another good be switched over to producing the good with the higher price?
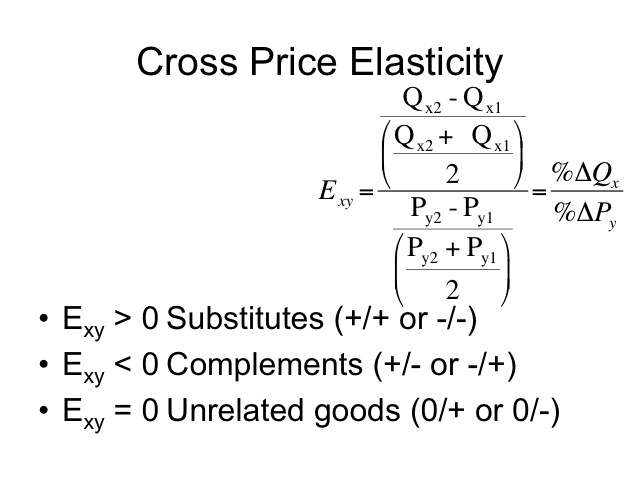
The cross price elasticity measures the percentage change in the quantity demanded for one good, say good x, given the percentage change in the price of another good, say good y. The elasticity is compared to zero.
If the price of good y increases and the quantity demanded for good x increases, the cross price elasticity would have a positive sign and the goods are considered substitutes. Raising the price of one soft drink causes consumers to consume more of the other soft drink since it is now relatively less expensive. A decrease in the price of beef causes a decrease in the quantity demanded of pork.
If the cross price elasticity of the two goods is negative, they are considered complements. Complements are consumed together so an increase in the price of digital music players, e.g., iPods, would lead to a decrease in the quantity demanded of online music downloads, e.g., iTunes.
When the quantity demanded doesn’t change as the price of the other good changes, the goods are considered to be unrelated and have a cross price elasticity of zero.
Practice
1. Compute the cross price elasticity and determine if the goods are substitutes or complements. Try not to look at the answers until after you have tried to figure it out on your own first.
Qx1 = 10 Qx2 = 11
Py1 = $1 Py2 = $1.05
2. If the cross-price elasticity of x and y is +0.5, then a 10 percent increase in the price of y will change the quantity demanded of x by ____.
Answers
1. The goods are substitutes.
Qx1 = 10 Qx2 = 11 ΔQ = 1
Py1 = $1 Py2 = $1.05 ΔP = .05
Exy = (1/10.5) / (.05/1.025)
Exy = .09523/ .04878
Exy = 1.95
2. The goods are complements.
Exy = -.5 = %ΔQx / 10
Solve the equation by multiplying both sides by 10.
%ΔQx = -.5* 10 = -5 or -5 percent
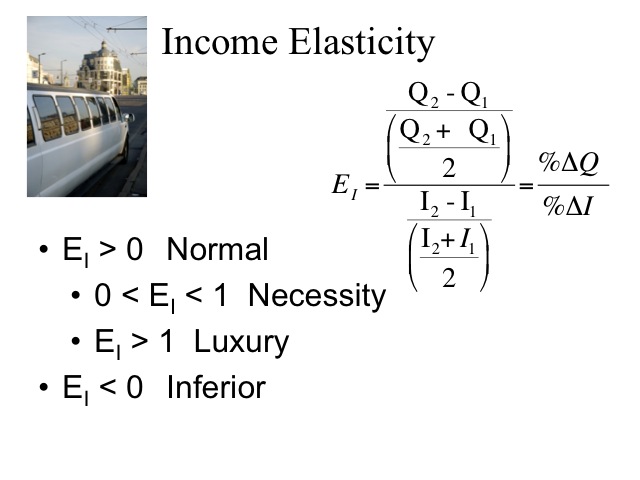
The last elasticity measure is income elasticity which measures the percentage change in quantity demanded given a percentage change in income. Goods and services with negative income elasticities are inferior goods and include items such as dry milk and second-hand clothing. As incomes rise people buy less of these goods.
Goods with positive income elasticities are normal goods and can be divided into two additional categories, those between 0 and 1 are necessities and those greater than one are luxury items. A one percent increase in income leads to more food, water, clothing, and housing but the quantity demanded increases by less than one percent. Quantity demanded of luxury items such as jewelry, leisure travel, elective surgery increase by more than one percent given a one percent increase in income. When incomes fall, the quantity demanded for these luxury items also falls by more than the percentage change in income.
Practice
1. Talise’s income increases from $25,000 to $30,000 per year and her demand for pizza increases from 12 to 14 per year. Compute her income elasticity. Try not to look at the answer until after you've tried to solve the problem on your own.
Answer
1. Pizza is a normal necessity for Talise.
(14-12) / (14+12)/ 2 / (30,000 – 25,000) / (30,000 + 25,000)/ 2 = .846
Understanding elasticities is critical when making pricing decisions in business. For example, Disneyland and Disneyworld offer a lower price for state residents. Since residents are closer and can go more often, their elasticity of demand is more elastic and total revenue for the company increases by decreasing the price. Nonresidents are less sensitive to price changes; vacationers that are required to travel a long ways will likely only go once during the year. Given that their demand is less elastic, the company makes greater profits by charging them a higher price.
If a company can divide their customers into different groups that have different elasticities, they are able to charge each group according their elasticity of demand. These groups may be by age, such as children rates or senior citizen discounts, or by geographical region, as shown in the example above.
Understanding cross price elasticities, businesses may reduce the price of a good below their actual cost. These loss leaders are priced to get the customers into the store and while purchasing that item, they also will purchase other items.
Governments can also use elasticities when determining the tax incidence or what portion of a tax is ultimately borne by the consumers and the producers. Governments often tax addictive substances such as alcohol and cigarettes since demand is relatively inelastic. These “sin taxes” serve two purposes - since they contribute to poorer health and additional medical costs that are often paid for by all citizens, it would be appropriate to tax those individuals using the products. The second justification is that the demand for these products is inelastic thus imposing a tax significantly increases tax revenues.
Elasticities are used to determine how much of a tax is borne by the producer verses the consumer. For example, when a tax is imposed on cigarettes, producers are able to pass along most of the burden of the tax by raising the price.
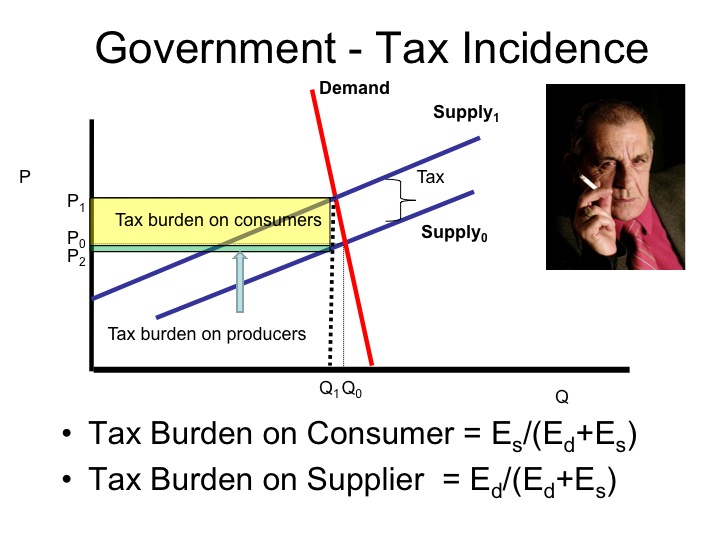
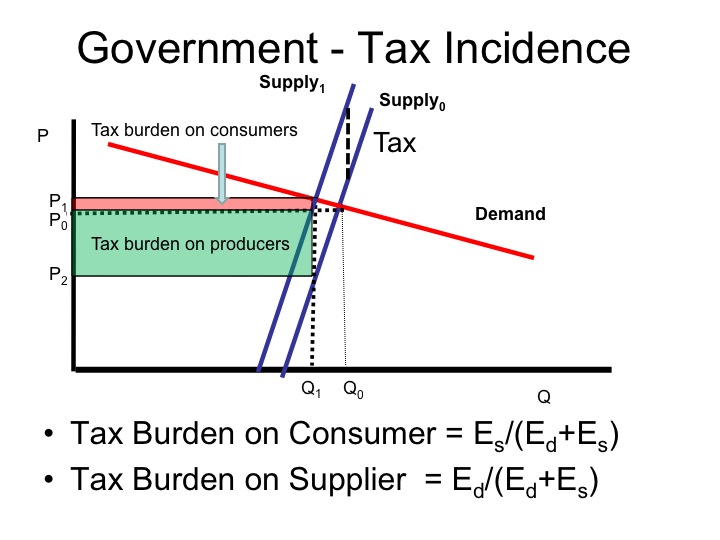
If the supply is more elastic than demand, then the producer will bear a greater burden of the tax. Using the equations above, if the elasticity of demand is 3 and the elasticity of supply is 0.5, then the burden of the tax on the consumer is .5/(3+.5) = .143 and the burden on the producer is 3/(3+.5) = .857. Thus 14.3 percent of the burden of the tax will be the consumer while 85.7 percent is upon the producers.
Practice
Tax Burden on Consumer = Es/(Ed+Es)
Tax Burden on Supplier = Ed/(Ed+Es)
1. Compute the tax burden on the consumer and the supplier given the following:
–Ed = 1 and Es = 2
Try not to look at the answers until after you have tried to find the solution on your own.
Answer
Tax Burden on Consumer = 2/(1+2) = 2/3
Tax Burden on Supplier =1/(1+2) = 1/3